Service Level
Service level
The service level (or service grade) is, generally speaking, a business indicator for the level of service achieved for customers, traditionally this includes delivery service in particular. It measures the performance of sales within the framework of a service, but can also be a measure of a manufacturer's pure willingness to deliver.
In todo4teams, the following four timestamps are created when a ticket is processed:
- Creation Date: Creation of the ticket, manually or by receiving an email, SMS, web form, etc.
- Start Date: Time the ticket is taken over by an editor
- End Date: Time the ticket is completed/closed
- Scheduled End Date: Scheduled time of latest completion
In the standardized, monthly reports from todo4teams, the service level of a team/skill is calculated as follows:
Service level = Proportion of tickets (of the total number of tickets for the selected reporting period) where the end time < the target time.
Erlang C
Another way to determine the service level is using the Erlang C algorithm.
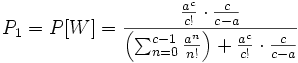
The probability that a caller to the hotline will reach an agent or have to wait on the hotline can be easily calculated using the queue theory of the mathematician Agner Krarup Erlang: You can forecast the personnel requirements based on the desired service level and the number of estimated service requests and take into account key figures such as the average processing time, the average response time and the average waiting time in the planning. The Erlang C functions are now available as a module in todo4teams and our other service center tools.
So you don't have to decipher the above formula - just use our ready-made implementation to forecast the most important key figures for your call center.
In addition to this pure calculation of a service level, the following additional metrics are relevant for determining service quality. These are not calculated by default in todo4teams, but can be determined relatively easily using database research
Measurement of the average duration of the first response when processing emails (average customer waiting time)
Time to first response when processing emails
Time to first response = timestamp of the first email response – date the ticket was created
Average duration to first response:
Average of the above values of the “time to first response” within a selected reporting period
Average Handling Time (AHT)
How quickly is a customer service ticket processed on average in todo4teams?
Calculation: Average of all tickets using the time stamp End time - start time
From the customer's perspective, the average waiting time is much more interesting: i.e. how long the customer waits on average for their request to be dealt with using todo4teams:
Calculation: Average of all tickets using the time stamp Creation time - end time
Individual measurements for a ticket
The following measurements can easily be derived when processing an individual ticket:
- Processing time (service center perspective): End time - start time
- Waiting time (customer perspective): End time - creation date
- Positive service case: If end time < target time
Orthogonally to this, the prioritization of a ticket naturally plays an additional role.